San Francisco is a city of neighborhoods—and the biggest pool of demographic data about small locales around the city is now available for data journalists to dive into.
The U.S. Census Bureau dropped the latest five-year batch of American Community Survey data today, giving San Francisco the first in-depth quantitative profile of its residents since 2020.
Here’s why analysts are squealing across the nation today:
The 2020 ACS release is not “the census” of yore. The true decennial census aims to actually count every resident in the country with a short survey fielded every 10 years.
Despite the pandemic and meddling from the Trump Administration, topline population data from the 2020 decennial census was released last year (and California lost a congressperson in the count.)
Though the ACS data normally comes out in August or September, the 2015 to 2020 release was delayed because significant revisions to methodology and weighting were needed to correct for the significant decrease in responses during pandemic fieldwork.
Today, instead of once a decade, the Census Bureau continuously fields the ACS’ longer survey around the country, gathering answers from 3.5 million households every year, and releasing the data annually, in single year and five-year datasets.
The data is not relied on as the “go-to” source for overall population statistics, so the study will not provide hard numbers or profiles of migrants to or from the city. (The Census Bureau says its Current Population Survey is its most accurate population count.) The first profile of post-Covid San Franciscans will come in the 2021 ACS single-year study slated for release this fall.
One Last Look at Pre-Pandemic SF
The new ACS five-year data provides the last complete picture of pre-pandemic San Francisco. Because the dataset released today is a cumulative profile of city residents from 2016 through 2020, it can only be compared to the five-year prior period. Here are three maps and several charts that highlight findings from the new ACS survey.
In SF’s Heyday, Household Income Rose Dramatically
While all ZIP codes in San Francisco showed income gains in 2016-2020, the top gainers posted significant increases of over 75%, notably 94158 in SoMa and 94102 in Hayes Valley, reflecting those ZIP codes’ gentrification in the past decade. The Inner Richmond (94118), Twin Peaks and Glen Canyon (94131) and Marina and Cow Hollow (94123) neighborhoods also posted income gains in the 50+ percentage range and also earned nearly $200,000, showing how the wealthiest households in the city continued to widen the income gaps. And the absolute wealthiest ZIP code according to the 2016-2020 ACS Survey was the Financial District (94105), where average annual household income was $335,851.
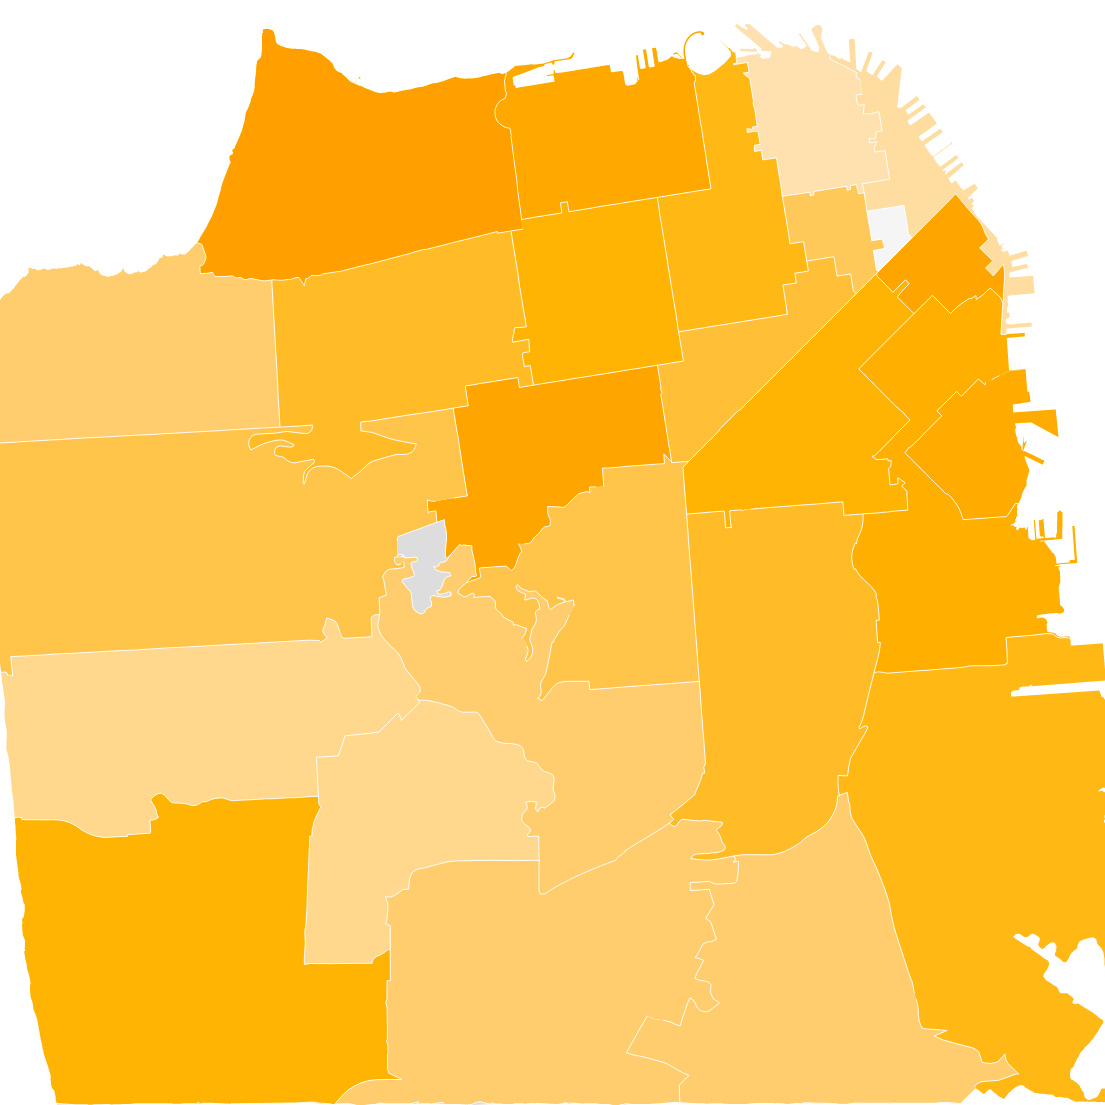
Younger San Franciscans Flock to the East Side
A look at median age in ZIP codes across the city finds the classic SF neighborhoods in the city center and along the Bay attracting a younger crowd. The ZIP codes with the youngest residents are found in SoMa, the Mission, the Marina, the Presidio and the Haight. The median age gets higher in the western ZIP codes that house more single family homes, like the Sunset and West Portal areas.
Love Can Be Found Across the City
SF as a whole is more or less gender balanced: for every 100 females, there are 104.1 males, according to the 2016-2020 ACS results. But breaking gender distribution down by ZIP code shows a far more different story, and those who are still seeking to meet a partner in real life (how quaint) should take note of which neighborhoods will provide a statistical advantage. Those seeking women should venture to the western side of the city, where women outnumber men. Those seeking men should stay away from the Marina and venture south of Market street to SoMa or the Mission. The gender data does not take into account sexual orientation, though: the ZIP code with the greatest imbalance of men over women may, predictably, be the Castro, with its decades-long history as a mecca for gay men.
America Has Nearly 1 Million Same-sex Households
For the first time, data on same-sex households is available from the Census Bureau. Though the ACS five-year dataset enables analysis of smaller demographic groups, the number of same-sex respondents is still too small to provide detail on geographies smaller than the state level. California’s 138,023 same-sex households are more likely to be married and in male-and-male relationships compared to the U.S. overall.
San Francisco’s Diversity Shines
More enhanced details in the ethnic and racial portion of the ACS questionnaire led to new insights about San Franciscans. Fully 7% count themselves as multiracial with 3% stating they are white and Asian. Chinese remains the most populous Asian group, at 21.1% of the SF residents, while 4.1% Filipino, 2.5% are Indian, and 1.8% are Vietnamese.
San Franciscan’s Didn’t Change Too Much During The 2010s
A look at overall demographics from the two most recent five-year ACS datasets reveals San Francisco hasn’t changed significantly. For both people and households, few big shifts are obvious, with a few notable exceptions: household income, rent, home value, and rent payments have gone up. Another metric on the upswing? The portion of SF people covered by health insurance moved from 91.5% to 96.4% in 2020.