The COVID-19 pandemic changed the way we live and work. These changes were especially stark in San Francisco, where lockdown compliance was higher than almost anywhere else.
One silver lining has been an apparent drop in crime, including a 21% decrease in all offenses and a 19% drop in violent offenses (mostly assaults and robberies) from 2019 to 2020. City officials have consistently pointed to the crime counts as evidence that the city has actually gotten safer. But viral videos of shoplifting incidents, attacks on Asian Americans and widespread perceptions that street crime is getting worse have put public safety concerns front and center.
District Attorney Chesa Boudin, who is facing a possible recall election based in part on crime concerns, captured the paradox well in July when he said: “despite the data, many people do not feel safe.”
Is it more than a feeling? The data he refers to ignore a simple fact about 2020: people stayed inside. Even with some decreases in crime, the city streets may have been more dangerous for those who ventured outside.
Typically, the crime rate (crimes per resident) or count of crimes within city limits are reasonable proxies for safety. But academics have noticed since at least the 1960s that the connection between these counts and safety is imperfect.
In a 1965 paper, Sarah Boggs pointed out that the robbery rate in Manhattan makes it seem more dangerous than it actually is: its daytime population is two times its number of residents. Many crimes per resident, perhaps; but fewer crimes per person present. In her words, “Although many crimes do take place in such areas, valid occurrence rates would be low relative to the number of potential targets or environmental opportunities for crime.”
Crimes per resident is convenient to calculate and usually helpful. But the dramatic drop in activity during the pandemic meant that crime rate and the risk of crime might have moved in different directions. If car use decreased more than break-ins, it’s possible that it was actually more dangerous to park your car in the city despite a decrease in the count of break-ins.
Accounting for the change in activity isn’t easy, but I attempted to answer this in particular contexts where it’s possible to measure how many people were at risk of victimization. An analysis of safety—as opposed to crime counts—suggests a more nuanced, and unfortunately bleaker, interpretation of recent crime statistics: violent victimization was higher on SF’s transit system, parked cars were just as likely to be broken into and more likely to be stolen, and pedestrians were more likely to be robbed or assaulted.
The district attorney's office disagreed with my approach. Their objections are detailed in the accompanying story.
Public Transit Data is Clear
I begin with SF’s Muni system, where the data is perhaps easiest to understand. Muni provides a count of both passengers and the total number of crimes on buses, trolleys, and cable cars. We can use these numbers to calculate how crime per passenger has evolved since the pandemic. How risky is it to ride the bus?

The results show that crime decreased on Muni, but ridership fell more. This means that crimes per million passengers—a standard measure of safety on public transit—rose during 2020. For most of 2020, Muni ridership was down 70-80%. Violent crime on Muni dropped less dramatically, from 55 to 37 quarterly incidents, on average, between 2019 and 2020. This means crime per million boardings nearly doubled and the average bus rider was more likely to be victimized.
This was not unique to San Francisco; the New York Times reported a similar change on the New York City subway. Public transit passengers, perhaps due to fewer “eyes on the street," were more likely to be robbed or assaulted.
Calculating Car Crime
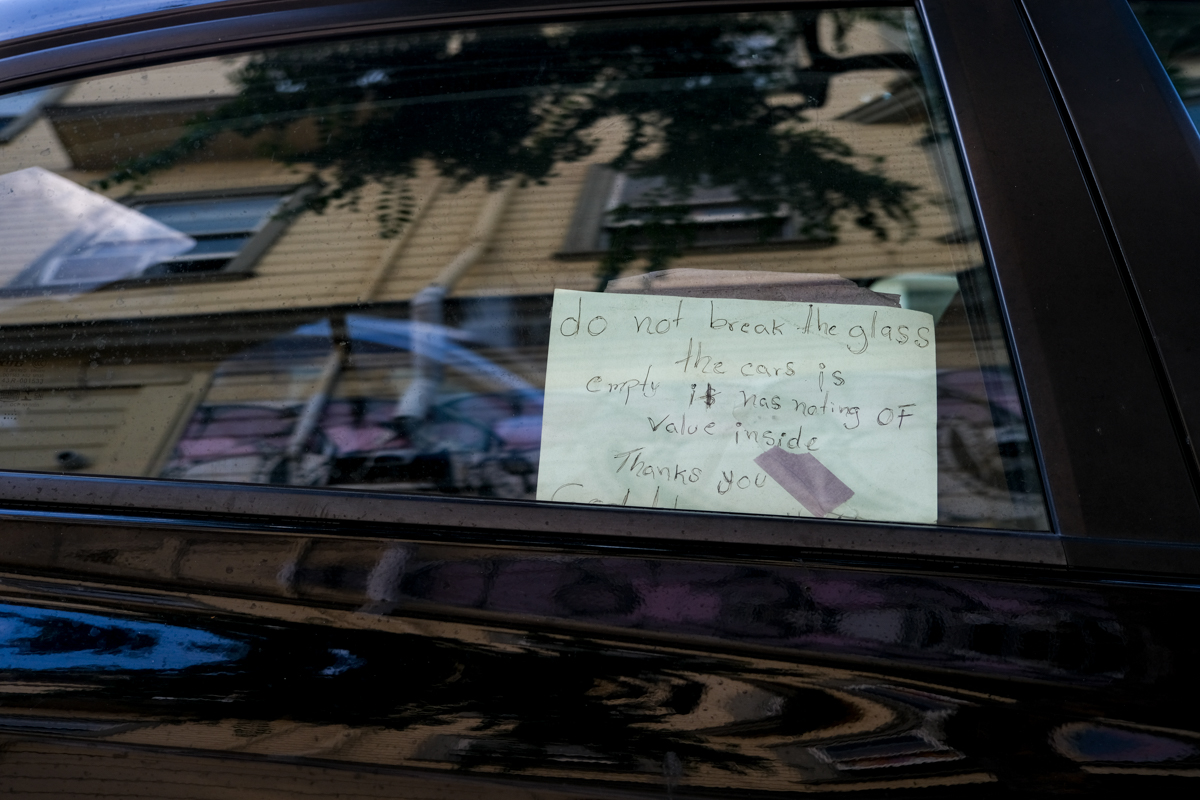
Car crime accounted for fully half of the index crimes in San Francisco in 2019. In fact, if you leave out car crimes, the 2020 decrease in the total number of crimes was 11% instead of 21%. The massive decrease was from a drop in break-ins. Car theft, on the other hand, increased by about 2,000. Was car crime less likely?
Arguably, the key question here is whether a car on the street was more or less likely to be broken into or stolen. And the lockdown left some streets deserted. According to some estimates, tourism was down 60%, and Fisherman’s Wharf, a hotspot for break-ins, was practically empty.
This means that a smaller number of break-ins may have afflicted an even smaller number of drivers, leading to an overall increase in risk.
Measuring the exposure of cars on the street is not easy, but the SFPD crime data is geocoded and some streets consist almost entirely of metered spaces. I combined the crime data with the parking meter data in order to calculate the risk of crime in metered spots—blocks where I could actually measure the number of cars and the time they spent parked.
This adjustment leads to a similar conclusion: despite an overall drop in car-related offenses, the risk of a car crime was roughly flat between 2019 and 2020. Total minutes parked on these streets dropped 60%. Break-ins fell by a similar proportion, from 809 in 2019 to 329 in 2020, meaning that the risk of a break-in each for each minute of parking was about constant. Vehicle thefts, on the other hand, dropped by 47%, from 160 to 85. With the deeper drop in parking, this means cars on these blocks were at higher risk of being stolen.
So, although the count of car crimes dropped, it was not safer to park a car on these blocks. If the same pattern was present throughout the city—and it seems most areas saw fewer cars on the street—the risk of car crimes went up.
SafeGraph Data Points to ‘Risk per Outing’
Another obvious concern is violent crime, which consists almost entirely of assault and robbery. Like larceny, these crimes decreased during the pandemic but, given the decrease in activity, it’s unclear how the risk of these crimes changed. To measure the risk of violent crime in the city, we want a sense of how many people were around.
For this task, I turned to SafeGraph data, which uses mobile location data to provide information on foot traffic at points of interest such as Chipotle and baseball stadiums. They also produce a Neighborhood Patterns dataset, with estimates of the total number of people in each census block group (designed to have 600-3,000 residents) over certain time periods.
With the geocoded violent crime counts and a measure of outside people in hand, I calculated a similar risk per outing as with bus rides and cars. The results show that the risk of violent victimization actually increased in 2020. People on the streets were around 20% more likely to be robbed or assaulted.
These measures aren’t perfect. The crime data do not indicate whether the crime happened indoors. This could be true of many domestic violence offenses, known to have increased during the pandemic, which would overstate the risk for the people outside. And SafeGraph, of course, does not have perfect information on everyone’s location, although it’s been shown to generally be in the right ballpark.
A similar analysis in New York City, with data that specifies whether the crime happened in a residence, shows a similar increase in the risk of victimization outside—a better match for the measure of activity that SafeGraph provides. And more broadly, the point should not seem that controversial: violent crime went down 20%, and numerous sources show that activity was down more than that. These two facts together already suggest that activity could have been more dangerous.
Residents May Have a Point
San Francisco, along with many large cities, had ostensibly salutary decreases in crime in 2020. However, if what we care about is safety from crime as we get groceries or walk our dogs, we have to work harder to understand exactly how things have changed.
In the glimpses provided here, I tried to use the most obvious possible measures of activity to calculate the risk in riding the bus, parking your car, or walking down the street. In all cases, due to a decline in all of these activities, the decrease in crime counts belies an increase in crime risk. Although I lack the data, the same is probably true of crimes like shoplifting: these offenses, by definition, can only happen when stores are open, and store hours dropped dramatically after the pandemic.
Because many cities experienced a drop in activity, these results are probably not unique to San Francisco in particular. And they do not have any direct implications about the role of public officials or criminal justice policies—it would take much more data and analysis to separate out the causal effects of policy from the pandemic. But if residents feel less safe, they may have a point.
Maxim Massenkoff is an economist at the Naval Postgraduate School.