The morning after a recent burglary spree in Union Square, Mayor London Breed zeroed in on the money—not what was gained or lost by the thieves and their victims, but rather the impact of such incidents on San Francisco’s massive, yet over-stretched budget.
“What happens when people vandalize and commit those level of crimes in San Francisco, we not only lose those businesses, we lose those jobs,” said Breed at a Nov. 20 press conference. “We lose that tax revenue that helps to support our economy that helps to support many of the social service programs that we have in the city in the first place. We can’t allow that to happen.”
As the city crawls out of the pandemic, its roughly $13 billion annual budget hinges in part on the fate of downtown: how quickly workers return to offices, how many merchants survive, and even sales tax revenue from holiday shoppers and tourists. Prior to the pandemic, Districts 3 and 6—which encompass downtown—generated more than half of the city’s sales tax revenue, along with an outsized portion of business and property taxes.
Bolstered by a roaring economy and tourism sector, San Francisco’s annual budget was on a steady upward climb for years, roughly doubling between 2011 and 2021. As the city’s economy boomed, businesses taxes nearly tripled between 2010 and 2020. Over the same period, flourishing tourism and conventions drove hotel and sales taxes past the billion-dollar mark; likewise, rising real estate values helped to push property tax collections, which are based on assessed values per year, to new heights.
But COVID knocked much of that growth off track, and San Francisco’s economy has been slower to recover than other major cities, at least by some measures: In a report published last week, the city’s budget office noted that despite improvements in recent months, hotel occupancy, office visits and trips downtown remained drastically below pre-COVID levels in October. Small business formation remains flat, and convention bookings—typically a cash cow for the city—are very slow.
During the pandemic, an infusion of federal and state funds helped to close the city’s budget gap—but continuing economic malaise spells an uncertain future for San Francisco’s precariously balanced budget.
Explore the visualization below to see how key revenue sources have changed over time.
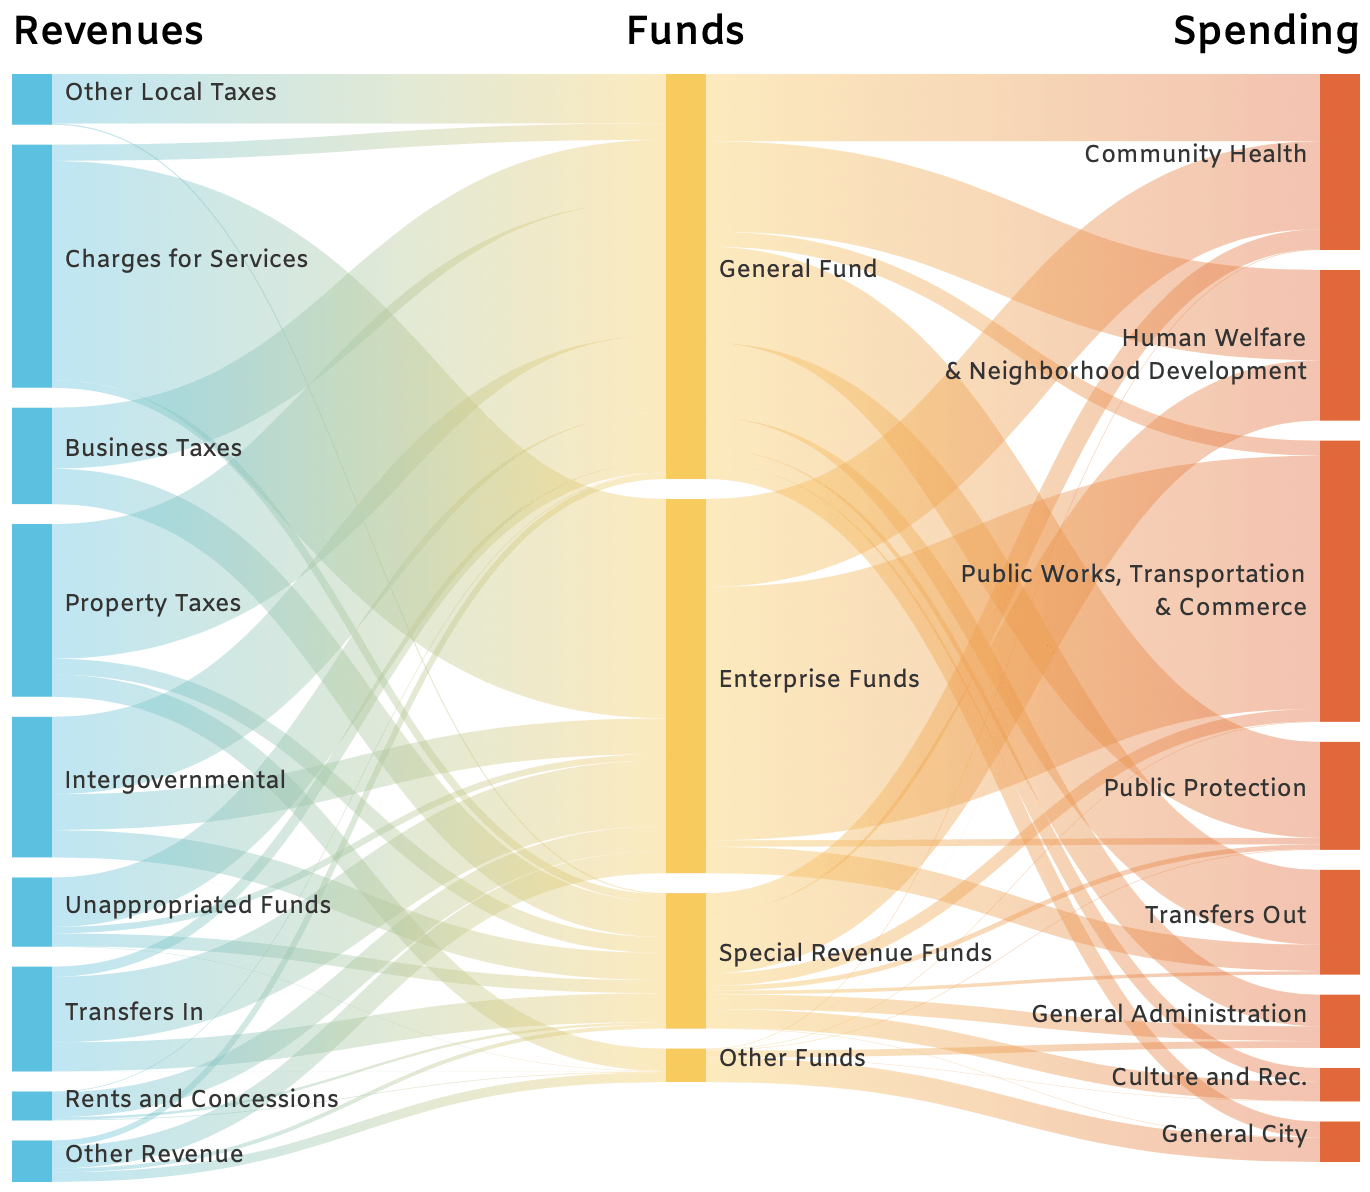
As to where San Francisco’s money goes, tax and other revenues flow into a highly complex collection of funds—some of which are restricted to specific uses, and others that are discretionary.
Unlike most other U.S. cities, San Francisco is incorporated as both a city and county. That means it carries out both municipal functions, such as police and fire, and county-level functions, such as courts. San Francisco’s budget also includes so-called “enterprise” departments that generate their own revenues and function much like a business: San Francisco International Airport, Port of San Francisco, Municipal Transportation Agency, the Department of Public Health and the Public Utilities Commission. Service charges, primarily from those departments, make up the city’s single largest source of revenue. Those revenues are restricted, and largely flow back into enterprise funds to support those same departments.
Most of the city’s local tax revenue flows into the General Fund, which reflects discretionary spending that can be adjusted each year as part of the budget negotiation process. Some revenues, however, are restricted to special funds serving a specific purpose—like debt repayment, capital projects, or parks and library maintenance—that voters have approved over the years. Transfers are authorized flows of money in and out of funds that help balance the city’s budget.
San Francisco’s spending is categorized by use, from public protection and community health to arts and culture. Click here to open the full interactive version of the chart below to see the flow of San Francisco’s money flows through various funds and uses in the current budget cycle.
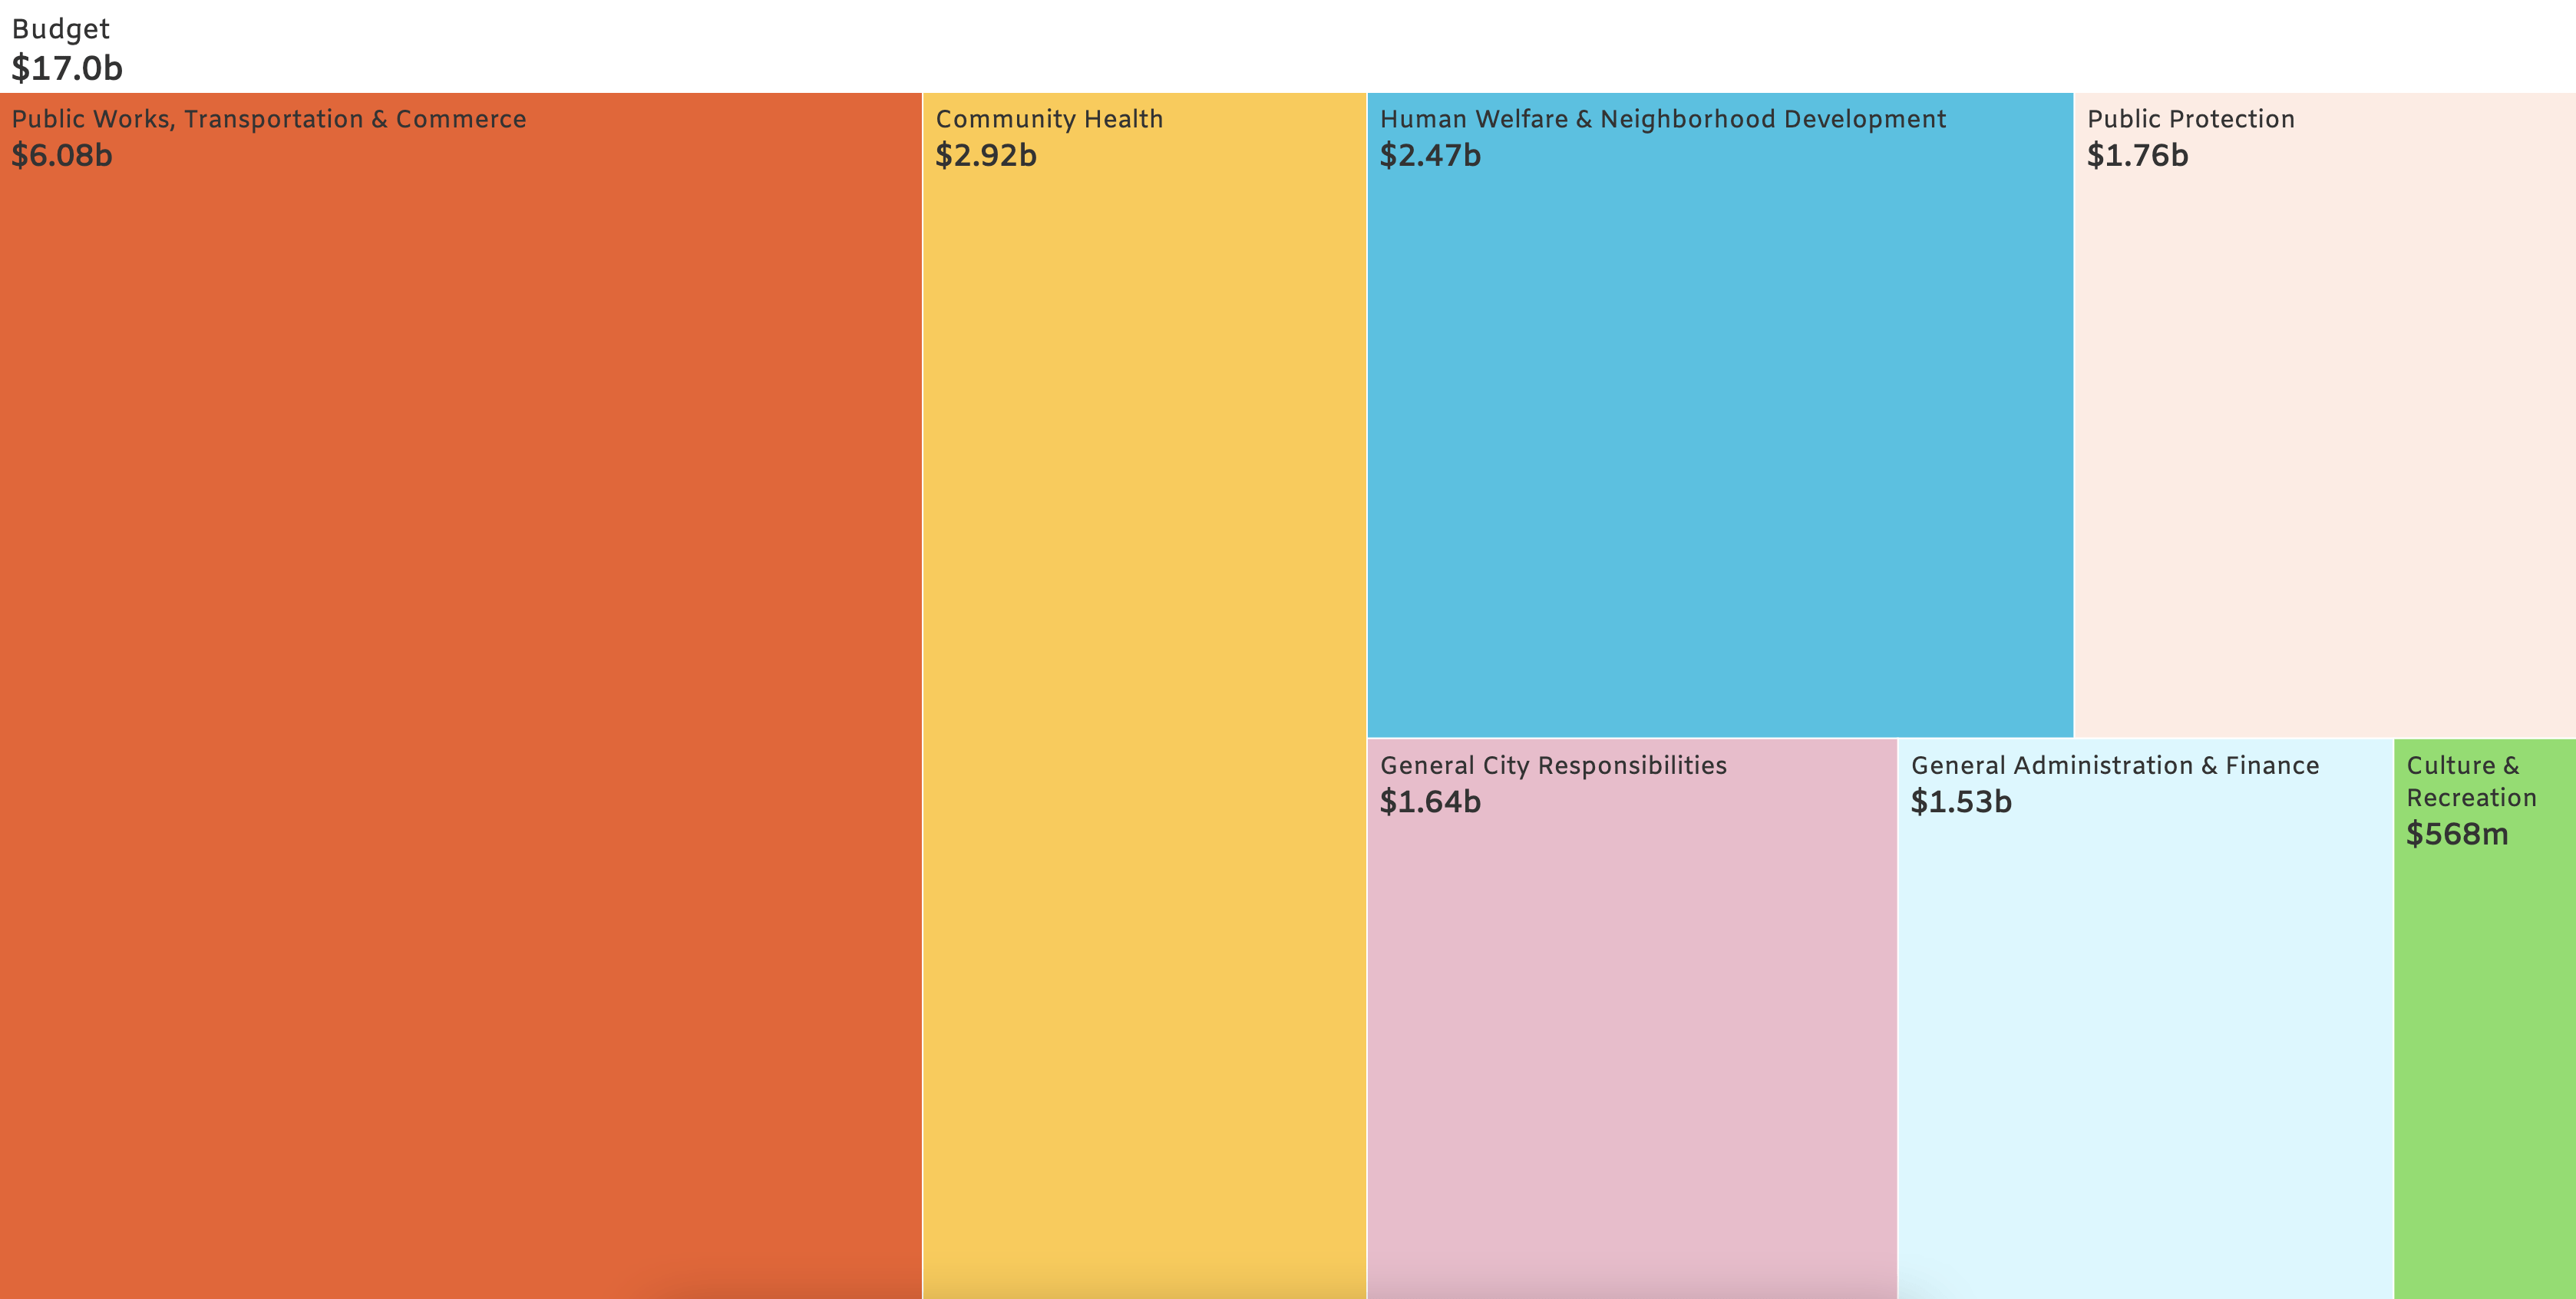
San Francisco’s money is allocated across 53 departments and agencies with budgets as high as $2.7 billion (Department of Public Health) and as low as $1 million (Board of Appeals) for the fiscal year ending in June.
Every year, the Mayor’s Office and the Controller’s Office review revenue forecasts for upcoming years and issue detailed guidance to city departments on the preparation of their budgets. Individual departments then submit their own budget plans to the Controller and the Mayor’s Office, which consolidates those budget requests into a balanced citywide budget proposal.
In June of each year, Supervisors hold a series of hearings with department heads, as well as with members of the public, in order to develop their own budget recommendations and requests for their districts. The Board of Supervisors must approve a final budget by August 1, which then heads to the Mayor’s desk for final signature.
In 2020 and 2021, the federal government passed two stimulus bills that allotted hundreds of millions in relief funds to San Francisco and other local governments that saw their revenues evaporate. Those stimulus funds flowed into San Francisco’s general fund, and into individual departments that were either heavily impacted by pandemic, such as the Municipal Transit Agency, or were tasked with emergency response, such as the Department of Homelessness and Supportive Housing, which received an infusion of state and federal monies for emergency shelter last fiscal year.
Click here to explore the interactive bubble chart shown below to see each department’s total budget for fiscal 2022, and how it compares to last year.
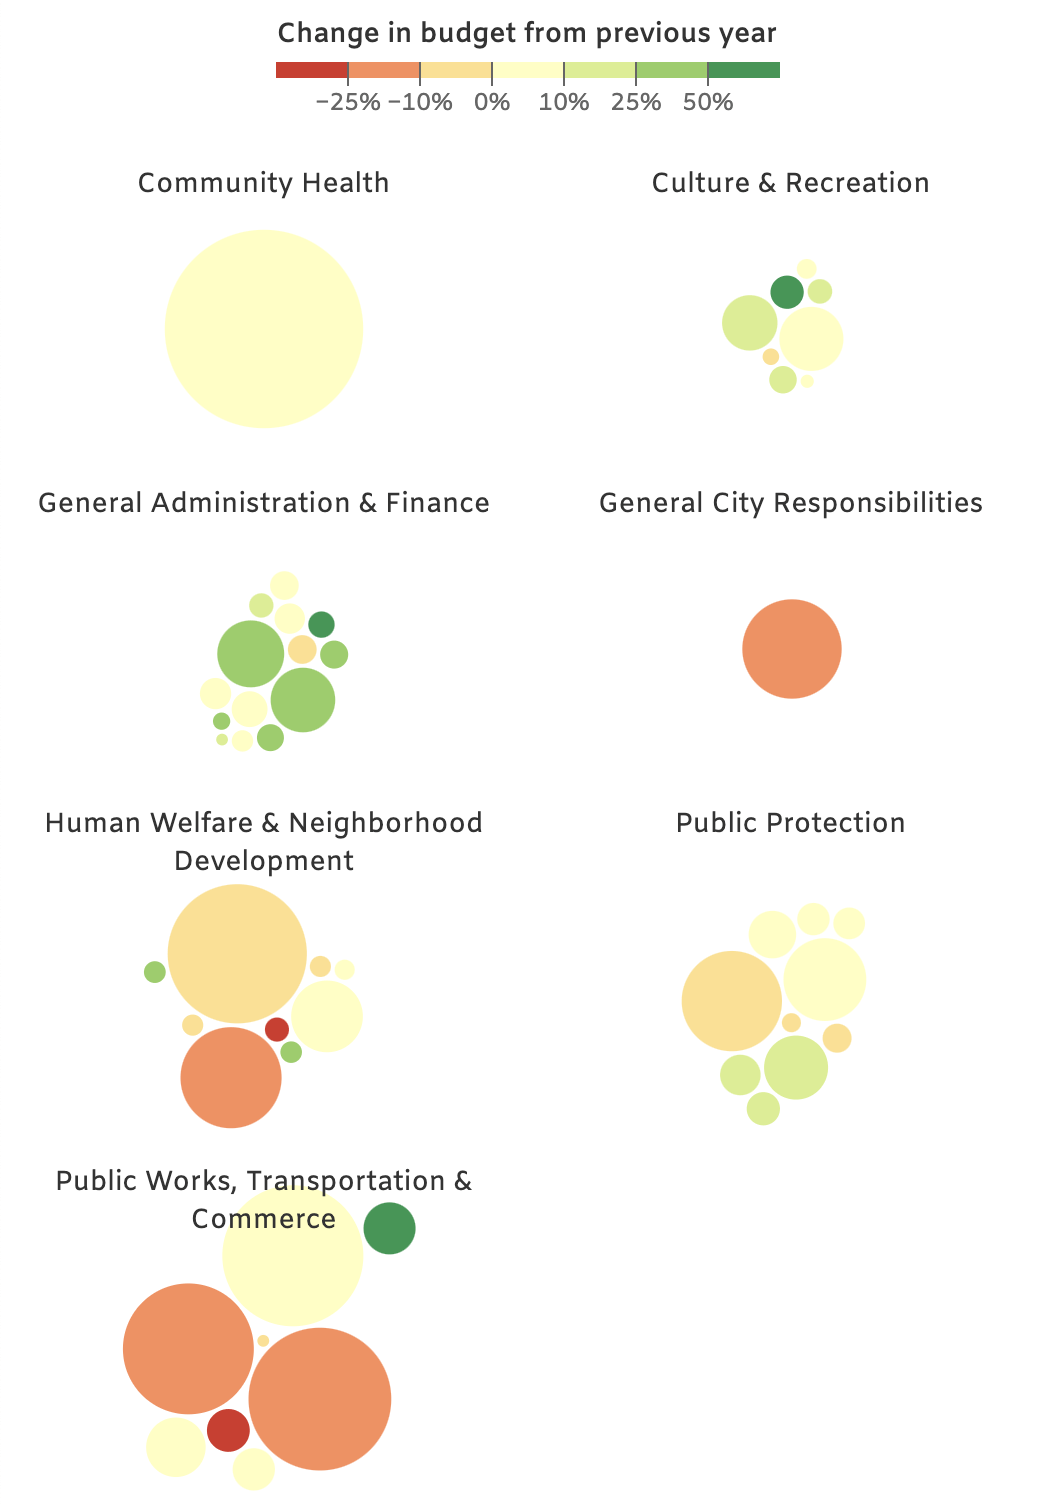
Department-level budgets are categorized by spending categories, fund source, and other details, and are codified in a document called the Annual Appropriation Ordinance each year. That document is the final citywide budget signed by the Mayor in August.
By a wide margin, the largest chunk of spending is compensation for the city’s workforce of roughly 35,000. Salaries and benefits typically make up the largest chunk of department-level spending. Depending on a department’s function, they might also allocate funds to areas like building improvements, capital projects, or grants to nonprofits. Departments also regularly hire other city departments for services like security, legal help, tax preparation, health care, or maintenance. The city’s budget analysts account for that activity through transfers, meaning those purchases are marked as revenue and adjusted later in the final budget preparation.
Click here to explore the visualization below to see how much each department plans to spend this year, and what those funds are used for.
Visualizations by Elbert Wang & Kaitlyn Bartley