Some say San Francisco is a hellscape caught in a perpetual doom loop, but according to a recent statistical analysis, the city has plenty to celebrate when it comes to its parks.
The City by the Bay ranks seventh nationwide for its open fields and grassy knolls dedicated to recreation and play, according to the Trust for Public Land, which evaluated park systems in the 100 most populous cities in the U.S.
The new 2023 rankings awarded Washington, D.C., the top spot for best park system in the nation, followed by the Twin Cities of St. Paul and Minneapolis, Minnesota, in second and third place. The Southern California city of Irvine took fourth place, and several major Bay Area cities, including Fremont, San Jose and Oakland, made the top 100, coming in at 21st, 32nd and 50th, respectively.
So why did SF take No. 7?
The city scored a perfect 100 out of 100 points for park accessibility: 100% of the city’s residents live within a 10-minute walk of a park, including 100% of residents of color and low-income residents. Boston is the only other big city to match that high level of walkability. Meanwhile, 73% of Fremont residents live within a 10-minute walk of a park, compared with 80% of San Jose residents and 89% of Oakland residents.
SF also earned a perfect score for its investment in parks. The city spends a total of $480 per resident each year on publicly accessible parks and recreation, and leads the nation in this category. Meanwhile, Fremont spends $155 per resident per year on parks, San Jose spends $150 and Oakland spends $103. The national average among big cities is $108.
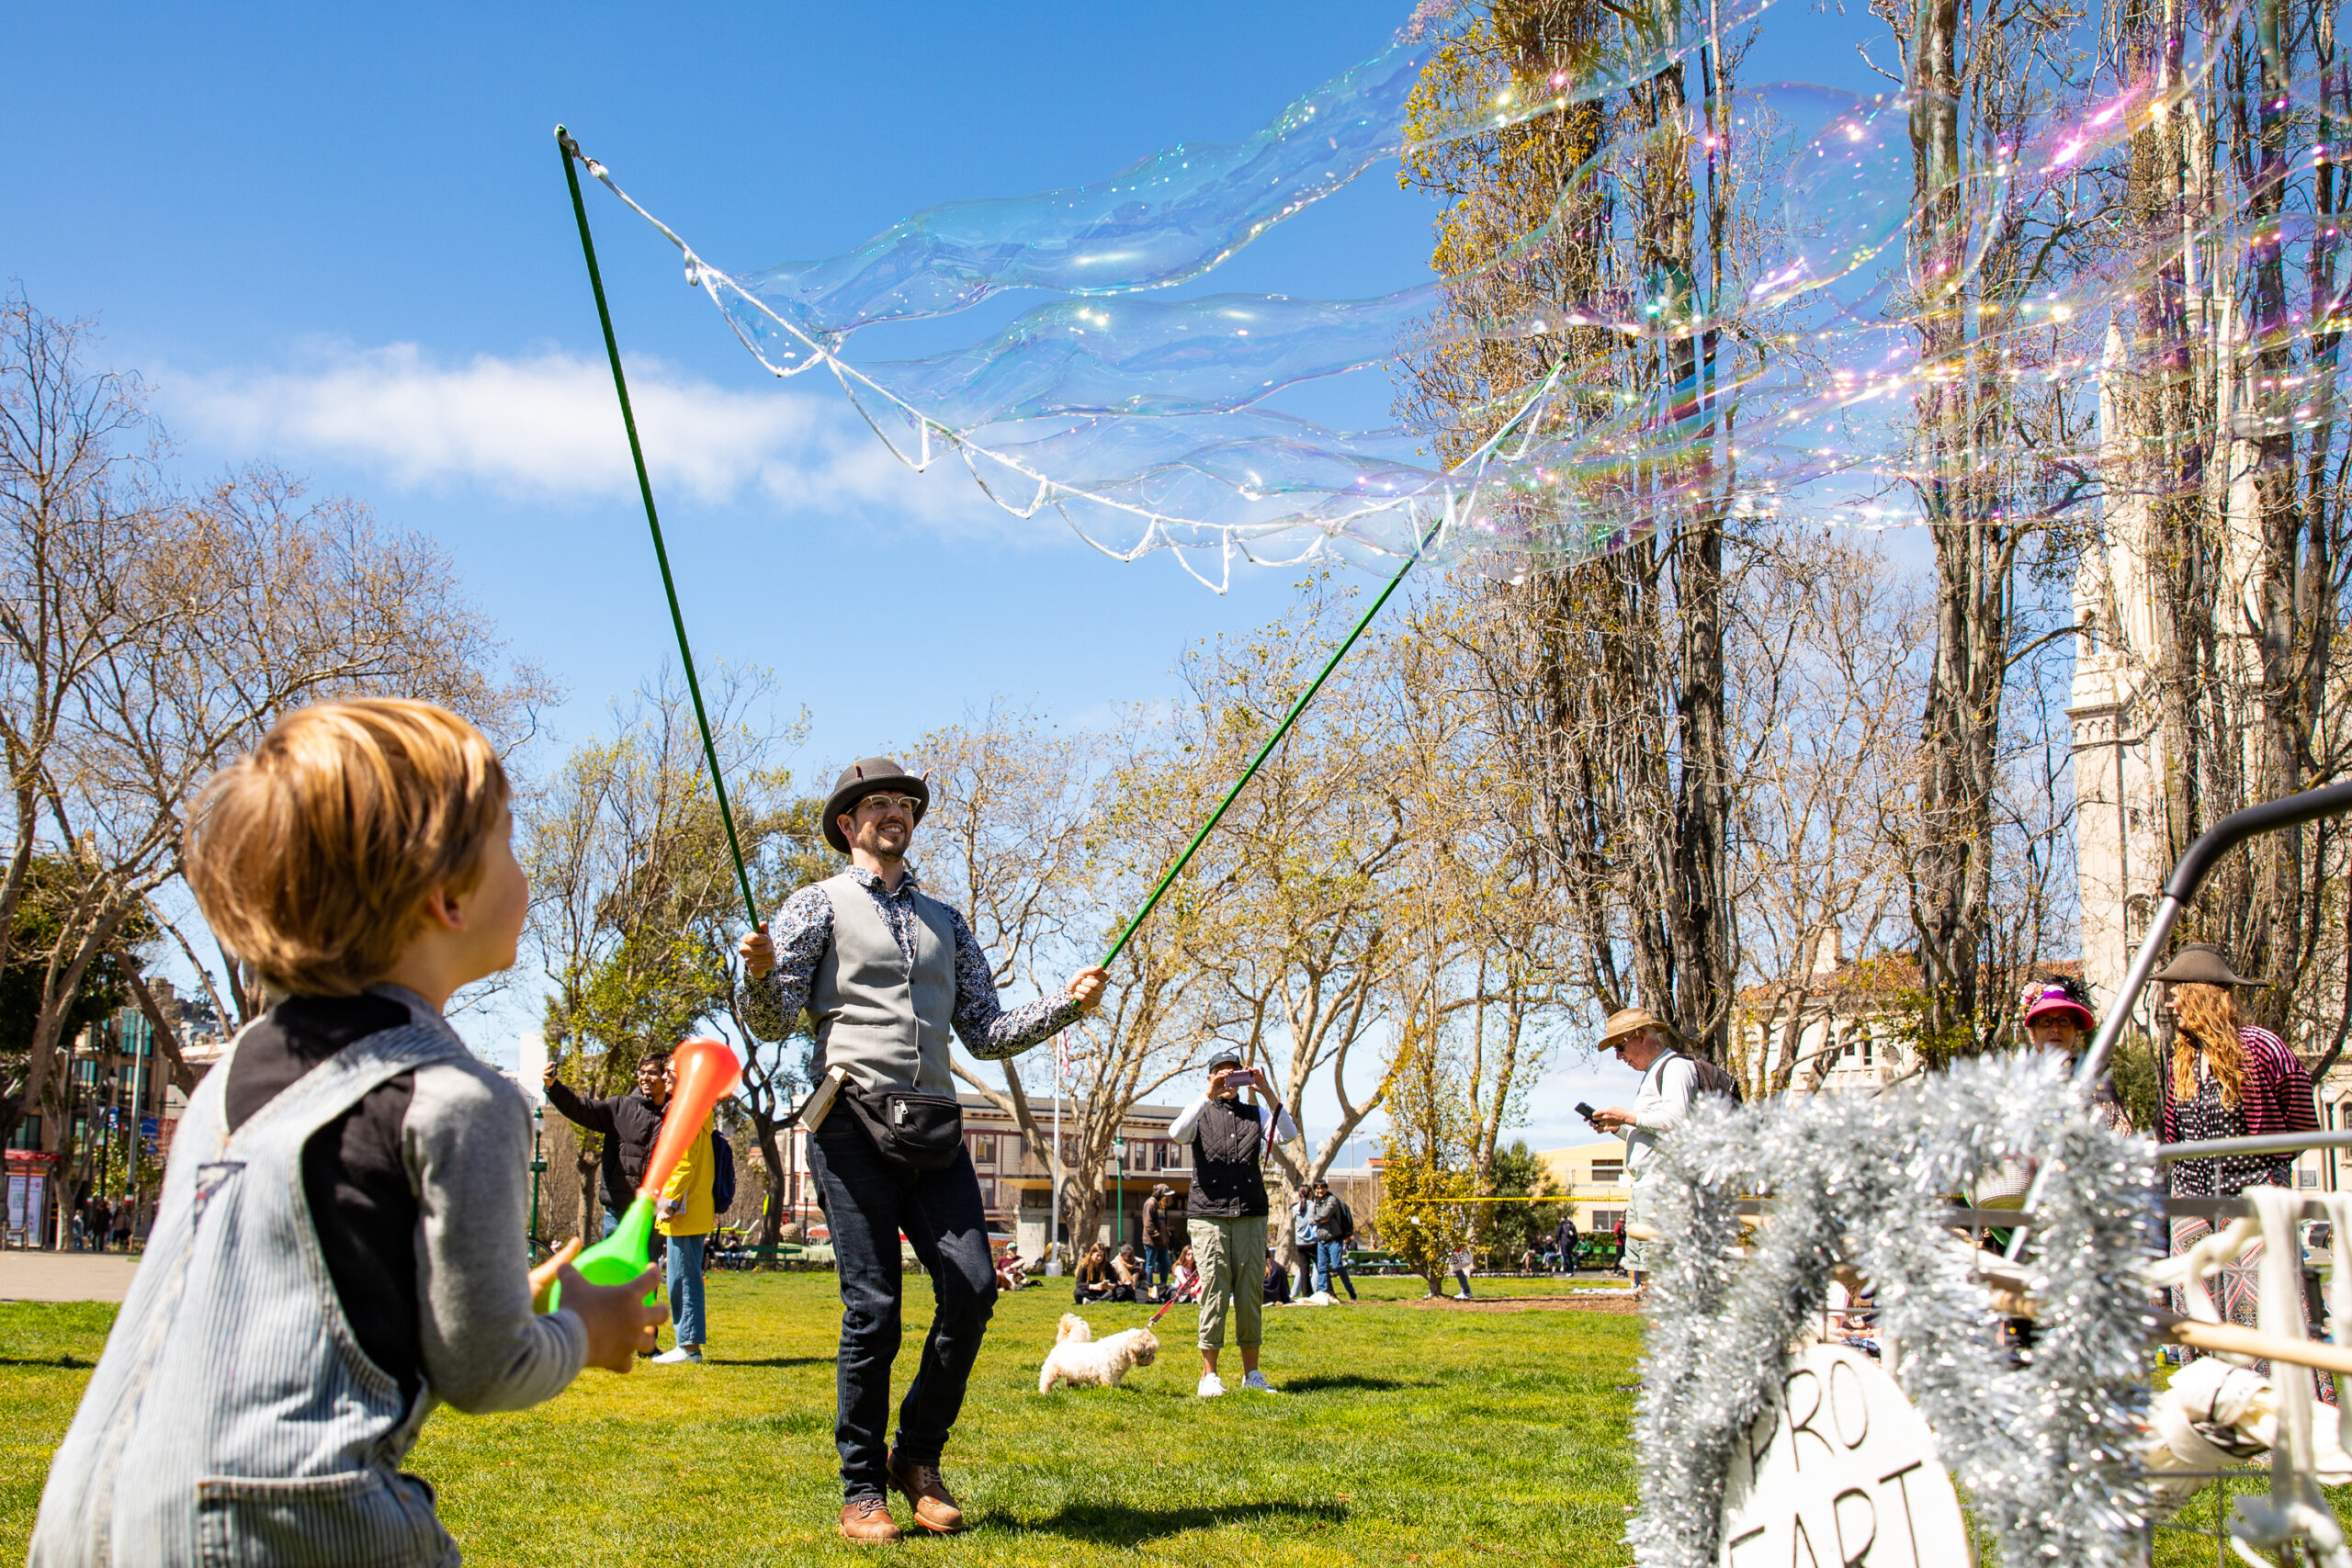
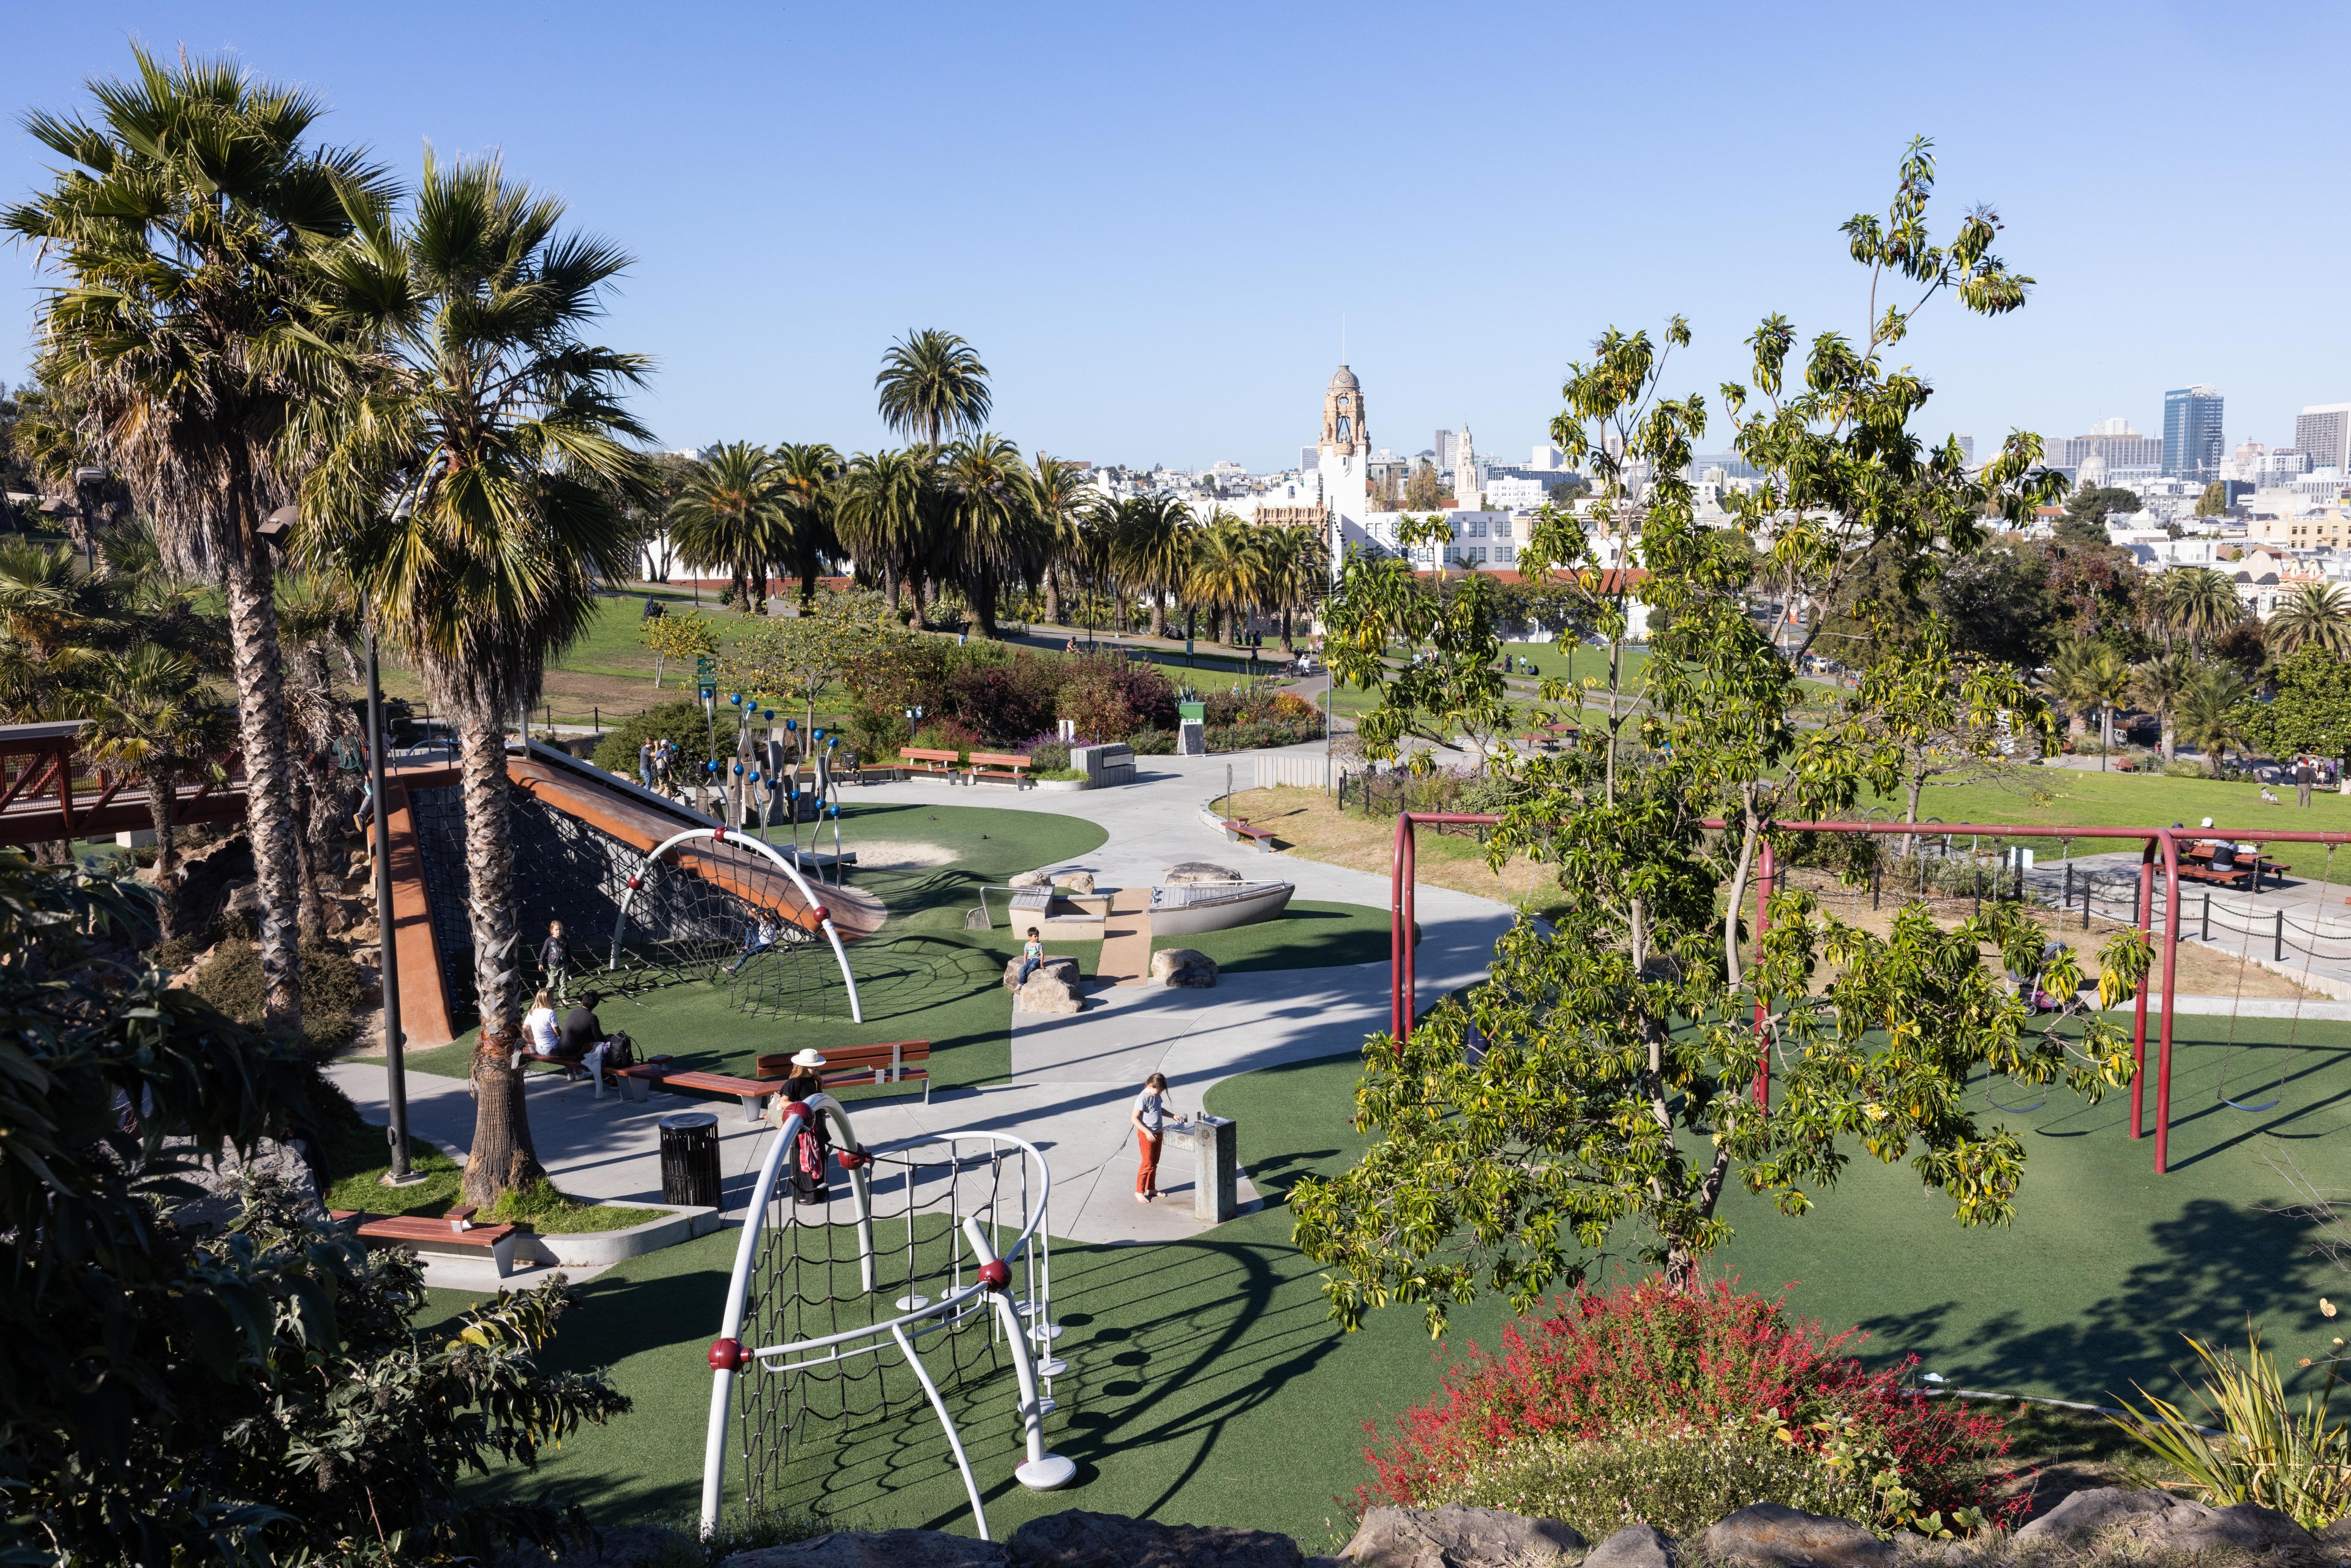
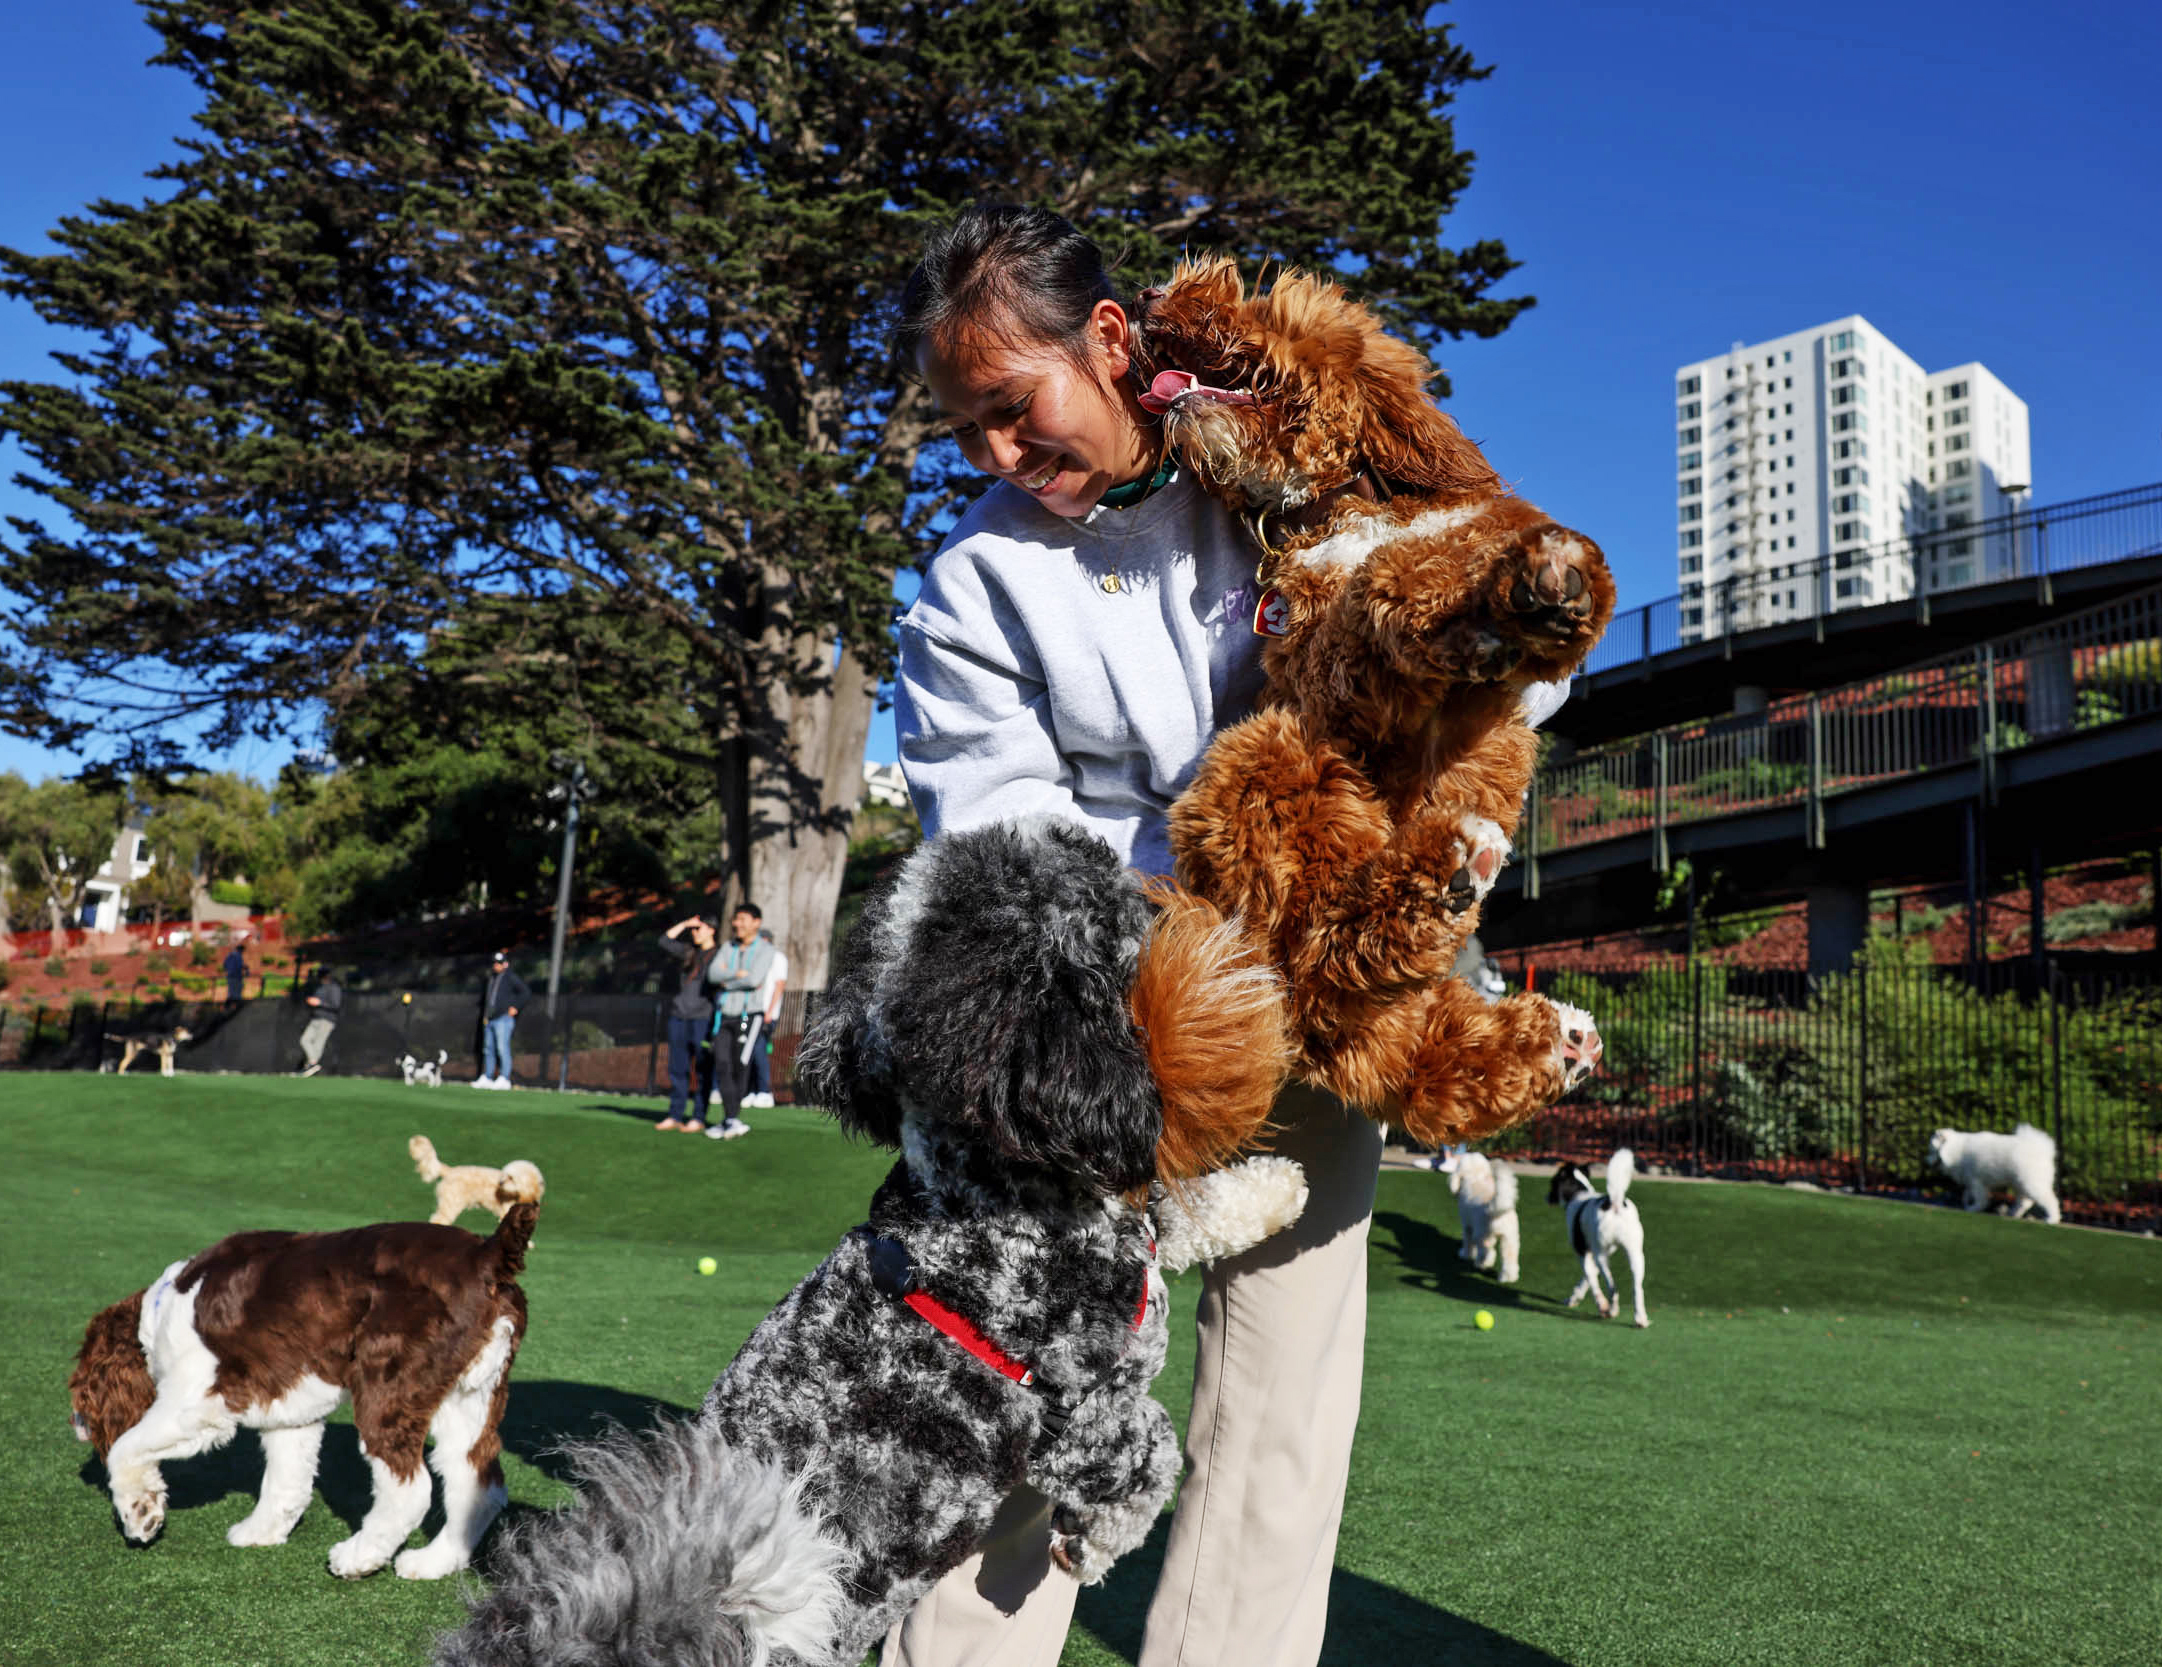
Boosting San Francisco’s score are impressive park perks and amenities, including a 100 score for the city’s beloved dog parks; 51 points for basketball hoops and rec and senior centers; 46 points for playgrounds and 45 points for splash pads. And while the city has become known for its (literally) crappy streets and been skewered for its consideration of a $1.7 million public toilet, surprisingly, the city’s parks scored a perfect 100 for bathrooms.
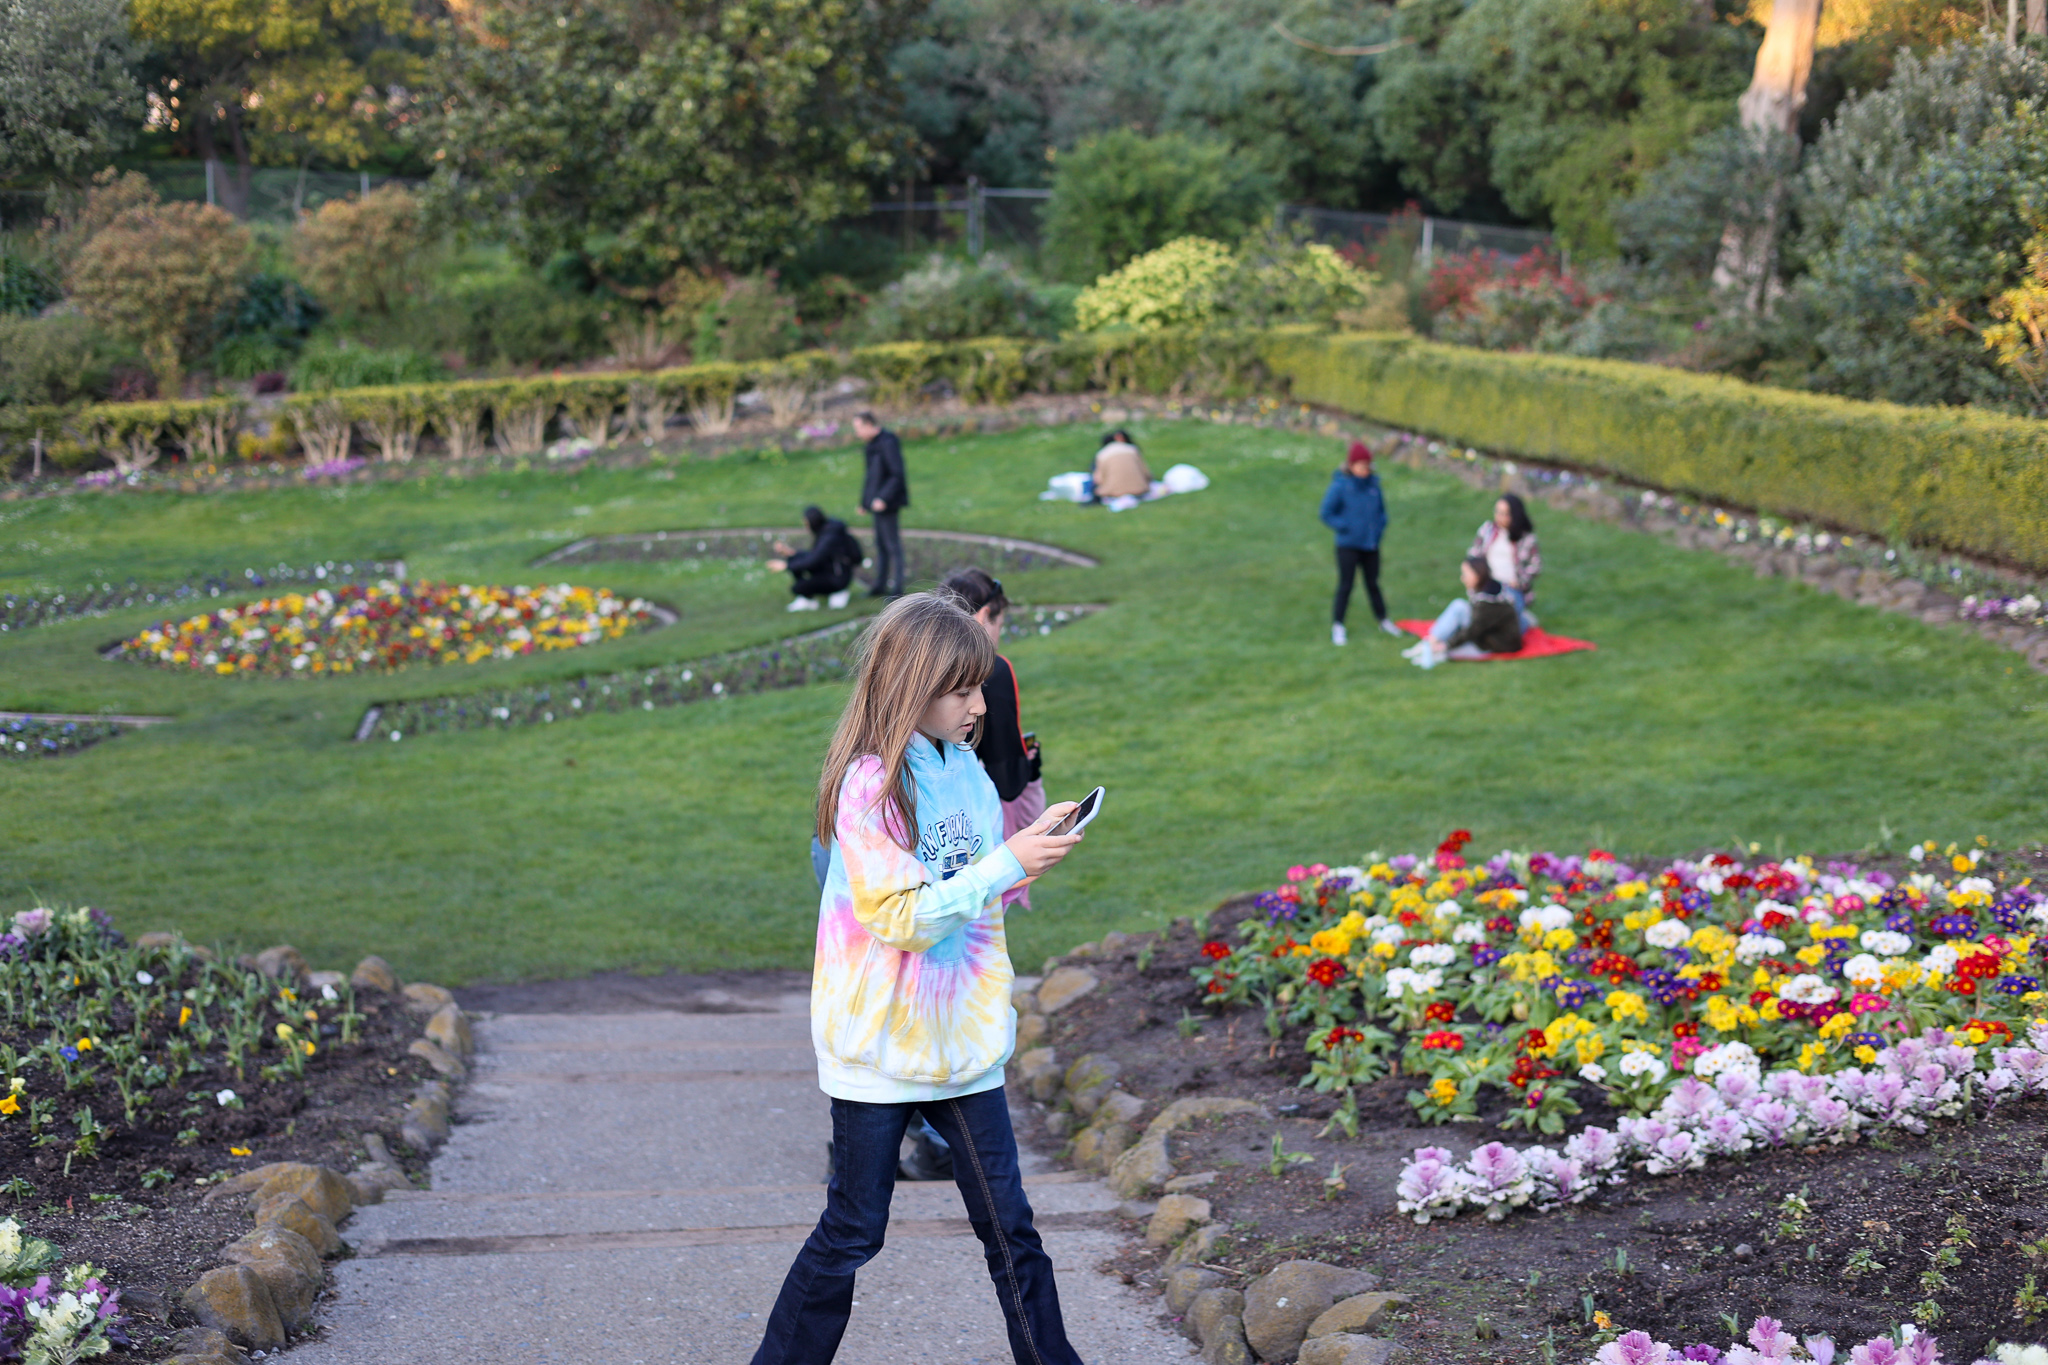
And with 6,164 acres of parkland and a total of 483 parks, a large percentage of the city’s overall area is dedicated to parkland, indicating a “relative abundance of large ‘destination’ parks,” according to the scoring index. National Geographic’s nod to the city’s impressive reimagining of outdoor space last year in its “Best of the World” list and opening of ambitious park projects, like Tunnel Tops and Francisco Park, supports this distinction.
Fremont also scored high on park acreage, with 21,957 acres dedicated to parkland, but it ranked average on park amenities. Oakland scored about average for park acreage and amenities, while San Jose scored average on park acreage and below average on park amenities.
On the equity front, Oakland and San Francisco scored among the highest for park accessibility, but neighborhoods of color and low-income residents still had less nearby park space than their peers in white and higher-income neighborhoods.
In contrast, neighborhoods of color in Fremont have access to 33% more nearby park space than those in white neighborhoods; although residents in low-income neighborhoods have 60% less nearby space than those in high-income neighborhoods. In San Jose, residents living in neighborhoods of color have access to 30% more nearby park space than those living in white neighborhoods. Overall, Fremont’s equity score was about average, while San Jose’s equity score was above average.
While the Bay Area has work to do to make its parks more accessible to all, at least we have an abundance of open spaces to retreat to when doomscrolling gets us down.